
Systems - Embedded Software - Circuits
Using Block Diagrams in Control Systems Design
by Tim Wescott
Wescott Design Services
(note: For more information on using block diagrams, and other
practical uses of control theory, see the book
Applied Control
Theory for Embedded Systems.)
Control systems engineers use block diagrams extensively in system analysis and design. Block diagrams provide two major benefits to the control system engineer: they provide a clear and concise way of describing the behavior and structure of the system, and when the block diagram �language� is limited appropriately they provide formal methods for determining system behavior.
This paper will cover methods of describing a system using block diagrams, a block diagram �language� that I have found to be very clear and detailed, some examples of other block diagramming �dialects� that you'll see in related literature, and finally some methods for analyzing system behavior using block diagrams.
1 The Language of Blocks
Figure 1 shows a block diagram. It is probably the world's simplest block diagram, but it is complete, none the less. The signal u feeds into a �Thing�, which transforms it into the signal y. The behavior of �Thing� is unspecified, so it could denote any signal processing function that accepts one signal and transforms it into another. What is specified in this block diagram is a single input signal, a single output signal, and the dependence of the output signal on the input signal and it's past values, and possibly on the initial conditions of the block �Thing� at some specified point in time.
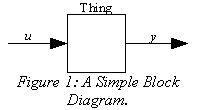
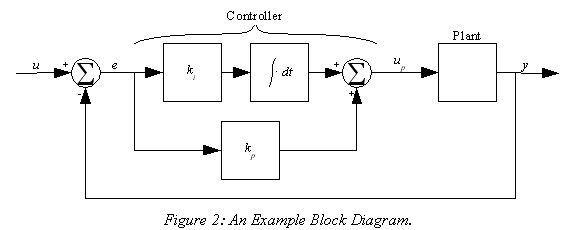
Figure 2 is an example of a block diagram showing a simple closed-loop control system. The diagram details a controller, and shows a plant with no detail. In the controller the command, u, comes in from the left, and has the feedback subtracted from it to form the error signal e. This error signal is applied to the kp gain block and to an integrator through the ki gain block, then the results are added and applied to the plant, which responds with the output to the right of the diagram.
Before launching into this discussion I should mention that there are no agreed-upon formal rules of block diagram structure unless one is using a system simulation tool. There appears to be a consensus when one is representing systems entirely in the Laplace or z domains, but on the whole block diagramming is an imprecise science. It is the responsibility of the system engineer to craft a block diagram that communicates the intended aspects of the system, and to accompany it with enough text to clarify its less common aspects.
Block diagrams consist of three main types of elements: signals, unary operator blocks, such as the �Thing� block in , and m-ary operator blocks such as the two summation blocks in Figure 21. In addition there are other elements such as sample-and-hold blocks, complex hierarchical blocks, signal sources, etc., that don't fit in the three main categories yet still need to be expressed if the block diagram is to be complete.
Every block has, at a minimum, one signal coming out of it. In general a block will have one or more input signal and one output signal, but blocks can be easily defined with more than one output as well.
Block diagrams can be hierarchical. Indeed, the entire block diagram detailed in Figure 21 could easily be the block labeled �Thing� in . Furthermore, the plant block in Figure 2 could (and in a practical application probably would) be expanded into a block diagram of it's own.
1.1 Types of Elements
1.1.1 Signals
A signal is represented by a line with an arrowhead at the end to denote the signal direction as shown in Figure 3. At your discretion it can also be named (the signal below is 'u'). A signal can, in general, be either a scalar signal that carries just one quantity or a vector that contains a number of individual signals. The choice of whether to bundle signals together into a vector is up to you. To avoid confusion the elements of a vector signal should be closely related and dissimilar signals should be kept separate.

1.1.2 Unary Operator Blocks
A unary operator block is represented as a rectangle with signals going into and out of it, and with a symbol or some text to indicate its function. is an example of a unary operator block that operates on the input signal with the transfer function H(z) to create the output signal. Unary operator blocks are almost invariably shown with the signals traveling horizontally, either right to left or left to right. As with signals it can be named by placing a name above or below it.

A unary operator block indicates that the output signal at any given time is entirely a function of the input signal. Unary blocks can be memoryless, where the the output signal at any given time is a function of the input signal at that moment. Unary blocks can also have memory, where the output signal at any given time is a function of the history of the input signal1.
1.1.3 M-ary Operator Blocks
An m-ary operator block is represented as a circle, often containing a symbol or graphics to indicate it's function. It will have two or more input signals and an output signal. The output signal is always a memoryless combination of the input signals. Figure 5 shows a binary summation block, where z = x � y.

1.1.4 Hierarchical Blocks
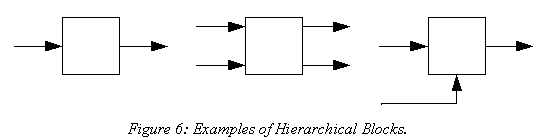
A hierarchical block can look much like a unary operator block, and when it does can function as one in a larger block diagram. Hierarchical blocks can also indicate more general functions: they can have multiple input signals, multiple output signals, and they can be shown with �auxiliary� I/O where there is some input to or output from the block that is depreciated or designated as being fundamentally different from the �main� signals.
Figure 6 shows some hierarchical blocks. The leftmost one shows how you might reduce a large single-input, single-output subsystem down to one block to show it in a larger block diagram. The center block shows how you might represent a system with multiple inputs and multiple outputs, while the last block shows a system with an �auxiliary� input, such a mode input or an on/off input.
1.2 A Dictionary of Blocks
Table 1 lists a number of blocks along with the function that they denote. It is by no means comprehensive, but gives a notion of the kind of things that blocks can represent.
|
Block |
Function |
Comment |
|
|---|---|---|---|
|
|
Implements the transfer function |
Generic form for a transfer function. |
(1) |
|
|
Implements a discrete integrator: |
This is (1) with |
(2) |
|
|
Implements the function f: y(t)=f(u(t)). |
The function should be memoryless; this is how you show system nonlinearities. |
(3) |
|
|
Implements the
function |
A specific case of (3). |
(4) |
|
|
|
A way to show memory in the time domain. |
(5) |
|
|
|
Sampled-time version of (5) |
(6) |
|
|
|
A graphical way of showing (3), in this case a limiter. |
(7) |
|
|
|
Simple summation |
(8) |
|
|
|
Multiplication |
(9) |
|
|
|
Division |
(10) |
|
|
|
Pick the minimum of the two signals. |
(11) |
|
|
|
Sample, see Figure 7 |
(12) |
|
|
|
Zero-order hold, see Figure 8 |
(13) |
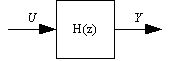
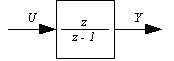
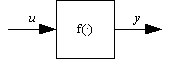

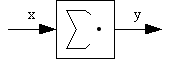
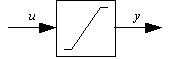
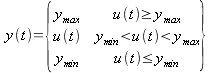
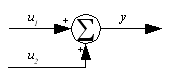
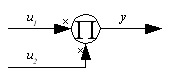

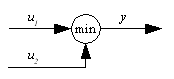
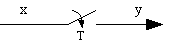
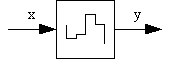
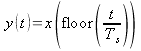
Table 1: Some Blocks and their Meanings.
1.2.1 Sample and Hold
A sample block is denoted by a switch with a descending arrow as shown in Figure 7. The period or frequency of the sample should be denoted underneath the arrowhead, or a 'T' inserted to denote a generic sample-and-hold. The function of a sample block is to sample a signal at an even rate. It is generally used to show continuous-time signals being converted to discrete-time signals for processing in a digital control system. It can also indicate a conversion from one discrete-time domain to another in systems where more than one sample rate prevails.

A zero-order hold is a device which transforms a discrete-time signal into a continuous-time one. Figure 8 shows a zero-order hold, with the graphic in the block reflecting the �staircase� appearance of a signal that's been sampled and reconstructed.

1.3 Block diagram dialects
As mentioned previously, there are no formal definitions of the block diagram �language� outside of proprietary simulation tools, and the usage of such tools tends to diverge from common �book usage�. This gives one the freedom to invent one's own dialect of the language for one's own purposes, but it places the responsibility for writing a clear diagram on your shoulders.
Indeed, the blocks presented here are the invention of the author; they follow what I have seen to be common usage, but I have made changes from common usage where I feel that my way is more clear or universal.
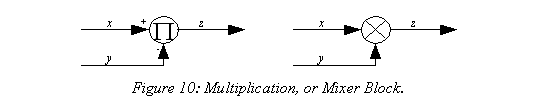
The major change that I've made to the common control system block diagramming language is in the multiple-input block. Common control system usage would show a summation block as in Figure 9; the center figure is the older form, but you will see both of them.
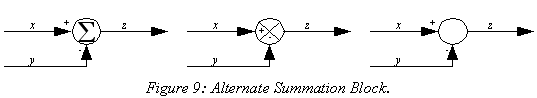
The reason for the change is that in radio usage one will often see a frequency mixer block denoted as a circle with an 'x' inside, similar to a summation block, yet a frequency mixer is generally a type of multiplication, which is certainly a different function than addition! Figure 9 shows an example, with a mixer/multiplication block on the right and an unambiguous multiplication block on the left.
2 Analyzing Systems with Block Diagrams
Block diagrams would be quite useful enough if all they were used for were to communicate system structure. They can, however, also be used to analyze system behavior, under certain sets of conditions.
If you have a system that can be represented entirely in the z domain (or Laplace), and the transfer functions of all the blocks are known, then the overall transfer function of the system can be determined from the transfer functions of the individual blocks and their interconnections.
Note that the above rule is not always altogether clear, because it is common practice to show a block diagram with a mix of z- or Laplace-domain blocks and nonlinear blocks, or with a mix of Laplace-domain blocks (indicating a continuous-time system) and z-domain blocks. Such systems can have their differential equations extracted, but they cannot be directly analyzed with the methods shown here.
2.1 Direct Equation Extraction
The most obvious method of analyzing a block diagram is to extract the relevant equations from it by inspection, then solve them directly. If the block diagram is fully specified this technique will always deliver a mathematical model of the system2. As we'll see this is not always the best way to proceed, but sometimes it is the only way.
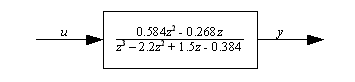
Figure 11 is a quite simplified3 block diagram of a heater control system. The plant is modeled as a heating coil that is driven by a controlled voltage, who's power output will be proportional to the square of the drive voltage. The temperature of the plant is modeled as a low-pass filtered version of the ambient temperature plus a temperature difference that's being driven by the heater coil. The controller is a simple PI controller.
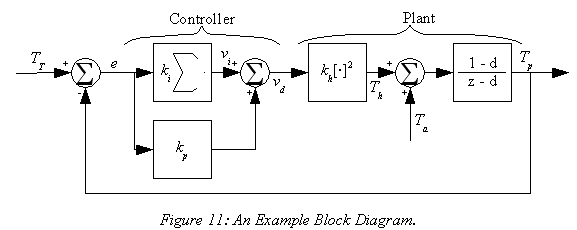
Developing the equations for the diagram in Figure 11 is tedious but straightforward. First, find the integrator voltage:
|
|
(14) |
then the heater offset temperature:
|
|
(15) |
then the plant temperature:
|
|
(16) |
Since the system of equations given in (14) and (16) are nonlinear they are not amenable to easy reduction, so in practice one would solve this equation by time-stepping, or by linearizing (16) around some operating point and solving the resulting linear difference equation.
2.2 Manipulating Block Diagrams
Initially one usually draws a structural block diagram. a diagram that shows how a system is put together. At some point one will wish to reduce this structural block diagram into a behavioral one. While this can be done by the techniques shown in section 2.1 above, such techniques immediately sever the connection between the block diagram and the behavioral model, and can be very counter-intuitive to use. It is often better to reduce a block diagram using the manipulation rules presented here.
There are four tools that you have to manipulate block diagrams. Given a block diagram that is described fully in the z domain or the Laplace domain these tools will allow you to fully analyze the block diagram to extract the overall system behavior. If you observe their limitations you can also use these tools on a variety of other block diagrams. The four tools that you have are: cascading gain blocks, moving summing junctions, combining summing junctions, and reducing loops.
The block diagram manipulations shown here only work if the blocks in question represent linear operations4. All of the examples below show block manipulations on blocks containing transfer functions in the z domain, however these manipulations can be carried out on any linear operation.
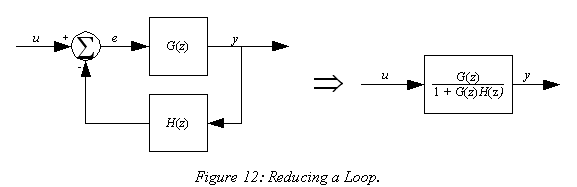
2.2.1 Loop Reduction
When a block diagram indicates a feedback loop you can reduce the loop to a single transfer function block as shown in Figure 12. If you look at the equations that govern the behavior of this block diagram, you can see that the output signal is a function of the forward gain G and the error signal e:
|
|
(17) |
The error signal, in turn, is a function of the input and output signals and the feedback gain:
|
|
(18) |
By substituting expressions, we get
|
|
(19) |
which reduces to
|
|
(20) |

Example 1: Using Loop Reduction.
A feedback control system has a forward gain
|
|
(21) |
and negative feedback with a gain of
|
|
(22) |
Draw it's block diagram, and find the overall transfer function for the system.
The block diagram is a simple feedback loop with the specified gains:
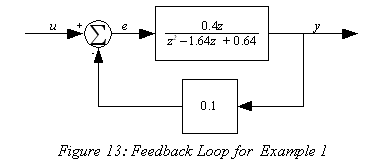
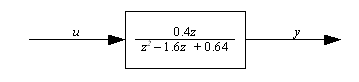
From the formula for loop reduction, the transfer function for the system is
|
|
(23) |
This reduces down to the block diagram:
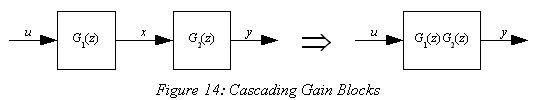
2.2.2 Cascading Gains
When two blocks are cascaded directly the transfer function of the combination is simply the product of the two transfer functions, as in Figure 14. Looking at the equations that govern the behavior of the block diagram you can see that
|
|
(24) |
From this, it is easy to see that
|
|
(25) |
Example 2: Cascading Gains.
A feedback control system has a plant with a gain of
|
|
(26) |
a controller with a gain of
|
|
(27) |
and unity feedback. Draw it's block diagram, and find the overall transfer function for the system.
The block diagram is:
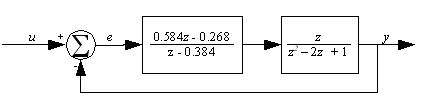
From the gain cascade rule the forward gain is
|
|
(28) |
Using the loop reduction rule with ![]() , the transfer function for the system is
, the transfer function for the system is
|
|
(29) |
This reduces down to the block diagram:
2.2.3 Summing Junctions
If a loop contains more than one summing junction it cannot be reduced by loop reduction, and cascading gains will not eliminate the extra junction. In order to reduce such a loop the summing junctions must be moved around until the loop contains only one. This is done by propagating a transfer function backward through the junction, or it's inverse forward through the junction, as shown in Figure 15.
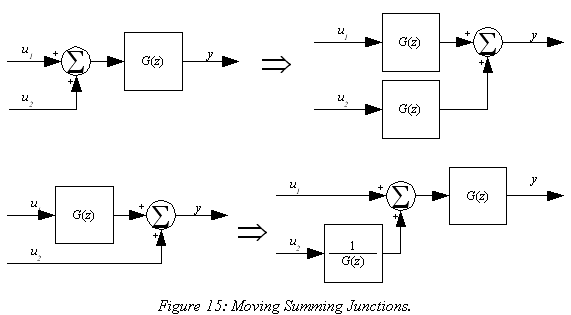
In the top case of Figure 15 the input/output relationship on the left is
|
|
(30) |
Using the commutative property of multiplication, this translates to
|
|
(31) |
which corresponds to the input/output relationship on the right.
In the bottom case of Figure 15 the input/output relationship on the left is
|
|
(32) |
By using the inverse of the transfer function, the right side becomes
|
|
(33) |
which is functionally the same as the left. Note that this manipulation only works if the operation in the block is invertible: if the block contained a zero gain, a sample or a hold, then the operation would not be valid.
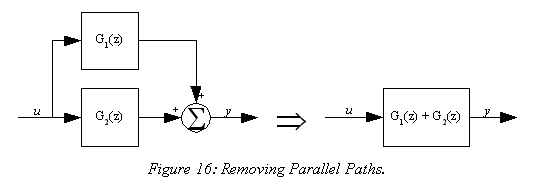
When a block diagram contains a pair of signal paths that originate from the same signal and terminate on a summing junction, the set can be reduced to a single block as shown in Figure 16. In this case it can be seen that
|
|
(34) |
From this it is easy to get
|
|
(35) |
Example 3: Cascading Gains.
Feedforward is often used in control systems to increase the system response speed without unduly pushing the control loop bandwidth. Figure 17 shows one such system. Reduce the block diagram in Figure 17 down to a single block.
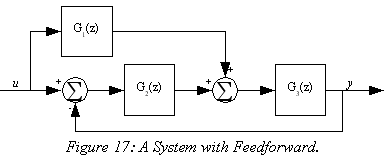
The loop in Figure 17 contains two summing junctions, which prevents the use of the loop reduction rule. We can either move the G1 leg back to the left summing junction, cascading G1 with 1/G2, or we can move the feedback leg forward to the right summing junction, putting a G2 block in the feedback path. I'll do the latter, to avoid the inverse:
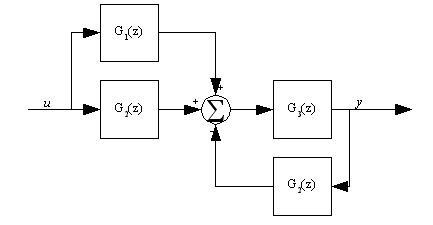
Using loop reduction for the right half and the parallel summation rule for the left gives us a transfer function of:
|
|
(36) |
2.2.4 Multiple-Input Systems
So far I've presented systems with just one input and one output (often called SISO systems for �Single Input, Single Output�). Real systems aren't restricted to having just one input and one output, and there is no reason that a block diagram has to be restricted in this way either. Even when you're working with a system that you'd like to treat as a SISO system, you'll find that reality may place additional requirements on your analysis.
It is often very useful to model a disturbance to a system in a block diagram. Figure 18 shows a block diagram5 with the plant split up into an actuator and a mechanism, and a disturbance force added to the force of the actuator on the mechanism. When dealing with such a system you are often interested in it's ability to reject disturbances, so you often want to find the transfer function from the intended input (u in this case) as well as the disturbance input (ud).
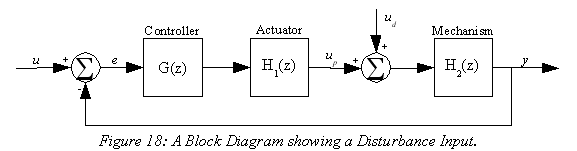
Both the transfer functions in question can be found almost by inspection from Figure 18. This is done by appealing to the fact that we're using a linear system model, which means that we can use superposition. To find the transfer function from the intended input to the output we assume that the disturbance is set to zero and solve the system normally:
|
|
(37) |
Similarly, to find the transfer function from the disturbance input to the output we set the intended input to zero and solve the resulting system:
|
|
(38) |
Notice that the denominator in (37) and (38) is the same. This is a general characteristic of feedback control systems: no matter how many inputs or outputs the system has, no matter how the system behavior may vary when you choose different points to inject signals or observe them, the underlying behavior of the system in terms of the poles of the transfer function will remain the same. The only times that you will see two different characteristic polynomials in one system will either be because you have two disjoint systems that happen to be on the same page, or because the numerator and denominator of the system share some roots6.
There is one other thing to notice about the system: it is often not necessary to derive all of the transfer functions directly. In this case one could have observed that by moving the summing junction for the disturbance back to the input summing junction the disturbance transfer function could be found from (37):
|
|
(39) |
If you do the math you'll see that (39) and (38) are equal. In many cases it is much easier to derive the desired function by this method rather than solving the block diagram twice.
Example 4: A Heater with PI Control.
Figure 19 shows a temperature control system where a plant's temperature is kept constant by controlling the power applied to a heater, but is disturbed by the ambient temperature (ud) The plant transfer function is
|
|
(40) |
The controller is a PI, with transfer function
|
|
(41) |
where the controller gains have been adjusted for a stable, rapidly settling plant.
Find the system's response to a change in ambient temperature and solve for the steady-state component of this response.
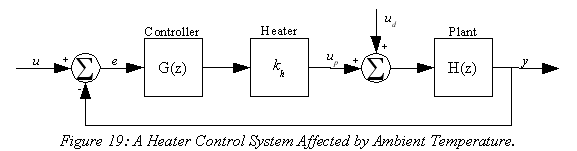
Borrowing from (38) the disturbance transfer function is
|
|
(42) |
Substituting in (40) and (41) this becomes
|
|
(43) |
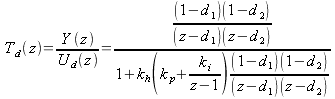 .
.Let kpp = (1-d1)(1-d2) and simplify to find the response to a change in ambient temperature:
|
|
(44) |
To find the response to a steady state change in ambient
temperature it in necessary to make a couple of observations: First, a
steady-state change in ambient temperature will have a number of components that
go to zero as time goes to infinity, plus a unit step response. Second, we
specified that the PI controller would be tuned such that the system is stable.
This insures that all of the system poles lie in the set of z such that ![]() .
.
With the first of these two observations we can apply the final value theorem to get an expression for the steady state error:
|
|
(45) |
With the second of these two observations we can deduce that the denominator of Td(z) will be a finite number as z goes to 1; thus (45) can be simplified to
|
|
(46) |
where k0 is known to be non-zero. At this point it is easy to see that the steady-state error is equal to zero.
2.2.5 Multiple Output Systems
A dual of the case with multiple-input, singe output (MISO) systems are systems with single inputs and multiple outputs (SIMO). As with the multiple-input case one often finds the multiple output case when we would rather be doing a simpler analysis.
Take the case of the command-following system in Figure 20 (which is just Figure 18 with the extra summing block removed and some extra signal labels). With such systems we're often concerned not only with how well the output is going to follow the input, but in what size the control signals will be for a given input.
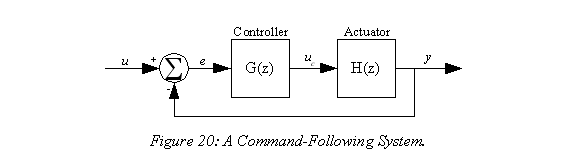
Assuming that we know the input, we only need to find the transfer function to have the output signal. As with the MISO case finding the transfer function from the input to the output can be done nearly by inspection:
|
|
(47) |
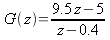
Example 5: Positioning System Drive Requirements.
A system as shown in Figure 20 is built with a voltage-driven, geared motor with time constant of approximately 20ms. The effective transfer function of the motor is
-
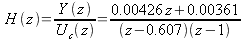
(48)
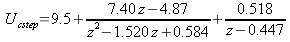
for per-unit drive and a motor output in radians. The controller has the transfer function
-
 .
.(49)
Find the transfer function from the system command input to the motor drive input. Find the maximum step command that can be given to the system without the motor's per-unit drive exceeding an absolute value of 1. Find the maximum ramp command that can be given to the system without the motor's per-unit drive exceeding an absolute value of one. Think of a way that the motor could be commanded to move 50% of its range without exceeding the maximum motor drive.
From (47) the transfer function from the command to the motor drive is
-

(50)
or
-
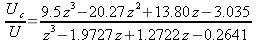 .
.(51)
Then the response to a unit step is found by multiplying (51) by a step:
-
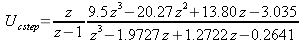 .
.(52)
-
 .
.(53)
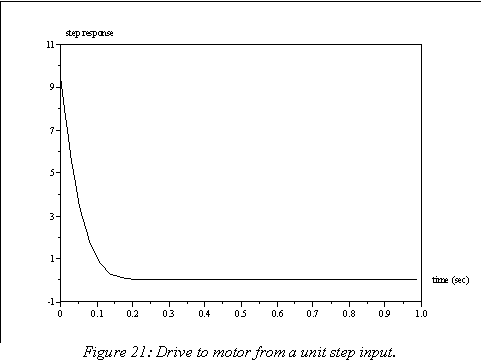
This response can be seen in Figure 21. As shown in the figure, the maximum value of the response occurs at the initial timestep, so the height of the response can be found by applying the initial value theorem to (52), which gives a value of 9.5. Thus, the maximum step command that can be given is equal to 1/9.5 = 0.105.
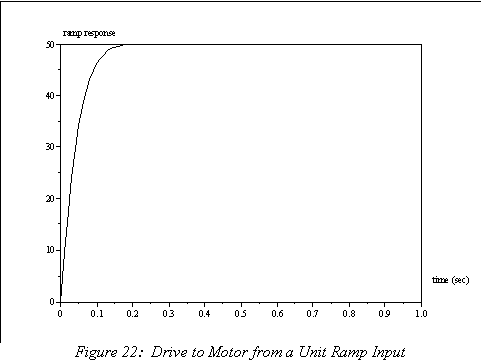
The motor drive response to a unit ramp input can be found in a similar manner. Multiplying (51) by a ramp gives
-
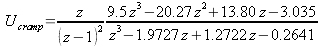 .
.(54)
shows the time-domain response. Clearly the final value of this response is also it's maximum, so the maximum motor drive can be found using the final value theorem. The final value of Ucramp is:
-
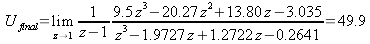 .
.(55)
Thus, the maximum ramp that can be imposed is 1/49.9, or approximately 2%/step, or 200%/second.
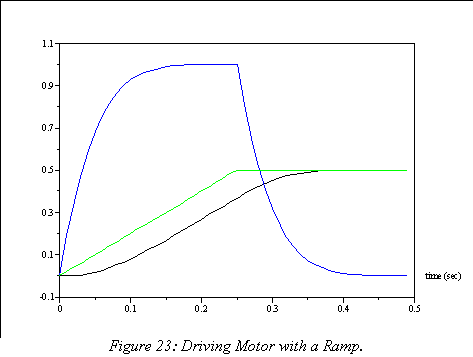
There are a number of ways that the motor can be driven to a position without exceeding it's maximum drive. One such way is shown in Figure 23, where the rate of change of the position command is limited to a 2% per sample ramp. The resulting position command, motor drive command, and motor position response are all shown, and as can be seen the motor command stays within appropriate limits.
1Generally this will be the past history of the input signal, but occasionally an author will show a block diagram that ignores causality and shows blocks whose output signal is a function of the entire history both past and future of the input signal.
2Maybe not a solvable one, but a model none the less.
3It ignores the fact that the plant is continuous-time, among other things.
4Recall that f(�) is a linear operation if and only if f(ax+by) = af(x)+bf(y) for all a, b, x and y.
5Ignoring the continuous-time nature of the actuator and plant.
6This is called �pole-zero cancellation� and while it may be a valid technique it should be treated with great caution.